与其他绘制森林图的包相比,forestploter将森林图视为表格,元素按行和列对齐。可以调整森林图中显示的内容和方式,并且可以分组多列显示置信区间。森林图的布局由所提供的数据集决定。
基本的森林图
森林图中的文本
数据的列名将绘制为表头,数据中的内容将显示在森林图中。应提供一个或多个不带任何内容的空白列以绘制置信区间(CI)。绘制CI的空间由此列的宽度确定。
首先准备绘图数据
library(grid)library(forestploter)# Read provided sample example datadt <- read.csv(system.file("extdata", "example_data.csv", package = "forestploter"))# Keep needed columnsdt <- dt[,1:6]# indent the subgroup if there is a number in the placebo columndt$Subgroup <- ifelse(is.na(dt$Placebo), dt$Subgroup, paste0(" ", dt$Subgroup))# NA to blank or NA will be transformed to carachter.dt$Treatment <- ifelse(is.na(dt$Treatment), "", dt$Treatment)dt$Placebo <- ifelse(is.na(dt$Placebo), "", dt$Placebo)dt$se <- (log(dt$hi) - log(dt$est))/1.96# Add blank column for the forest plot to display CI.# Adjust the column width with space. dt$` ` <- paste(rep(" ", 20), collapse = " ")# Create confidence interval column to displaydt$`HR (95% CI)` <- ifelse(is.na(dt$se), "", sprintf("%.2f (%.2f to %.2f)", dt$est, dt$low, dt$hi))head(dt)#> Subgroup Treatment Placebo est low hi se#> 1 All Patients 781 780 1.869694 0.13245636 3.606932 0.3352463#> 2 Sex NA NA NA NA#> 3 Male 535 548 1.449472 0.06834426 2.830600 0.3414741#> 4 Female 246 232 2.275120 0.50768005 4.042560 0.2932884#> 5 Age NA NA NA NA#> 6 <65 yr 297 333 1.509242 0.67029394 2.348190 0.2255292#> HR (95% CI)#> 1 1.87 (0.13 to 3.61)#> 2 #> 3 1.45 (0.07 to 2.83)#> 4 2.28 (0.51 to 4.04)#> 5 #> 6 1.51 (0.67 to 2.35)
应用主题绘制简单的森林图
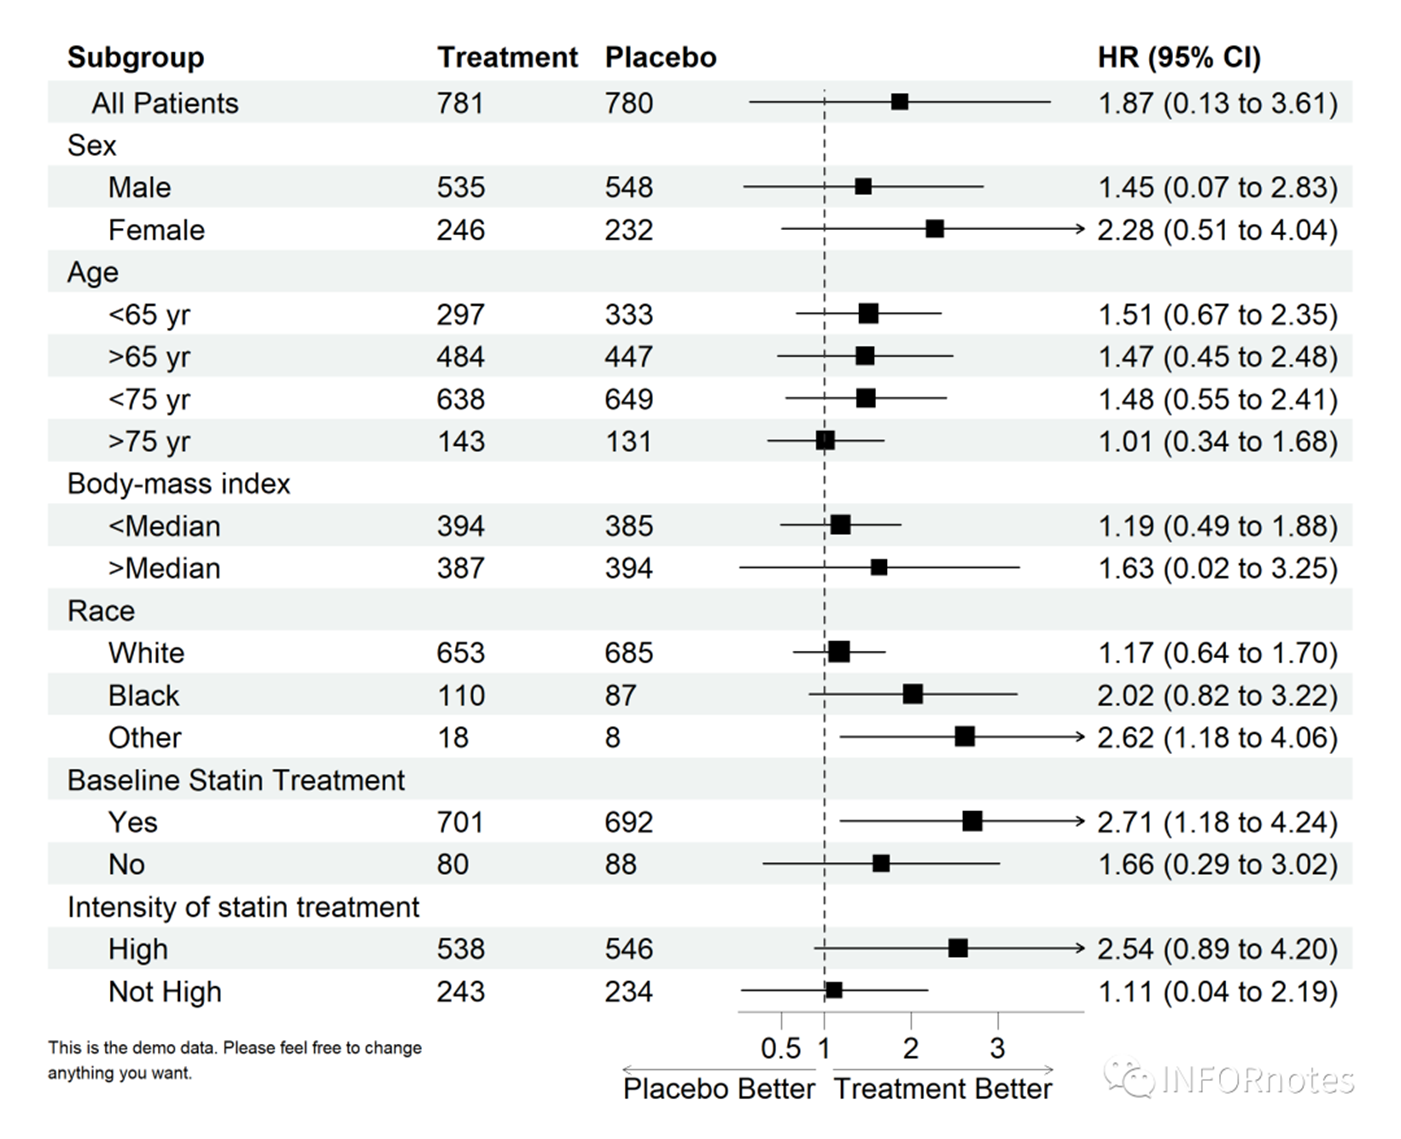
p <- forest(dt[,c(1:3, 8:9)], est = dt$est, lower = dt$low, upper = dt$hi, sizes = dt$se, ci_column = 4, ref_line = 1, arrow_lab = c("Placebo Better", "Treatment Better"), xlim = c(0, 4), ticks_at = c(0.5, 1, 2, 3), footnote = "This is the demo data. Please feel free to change\nanything you want.")# Print plotplot(p)
更改主题背景
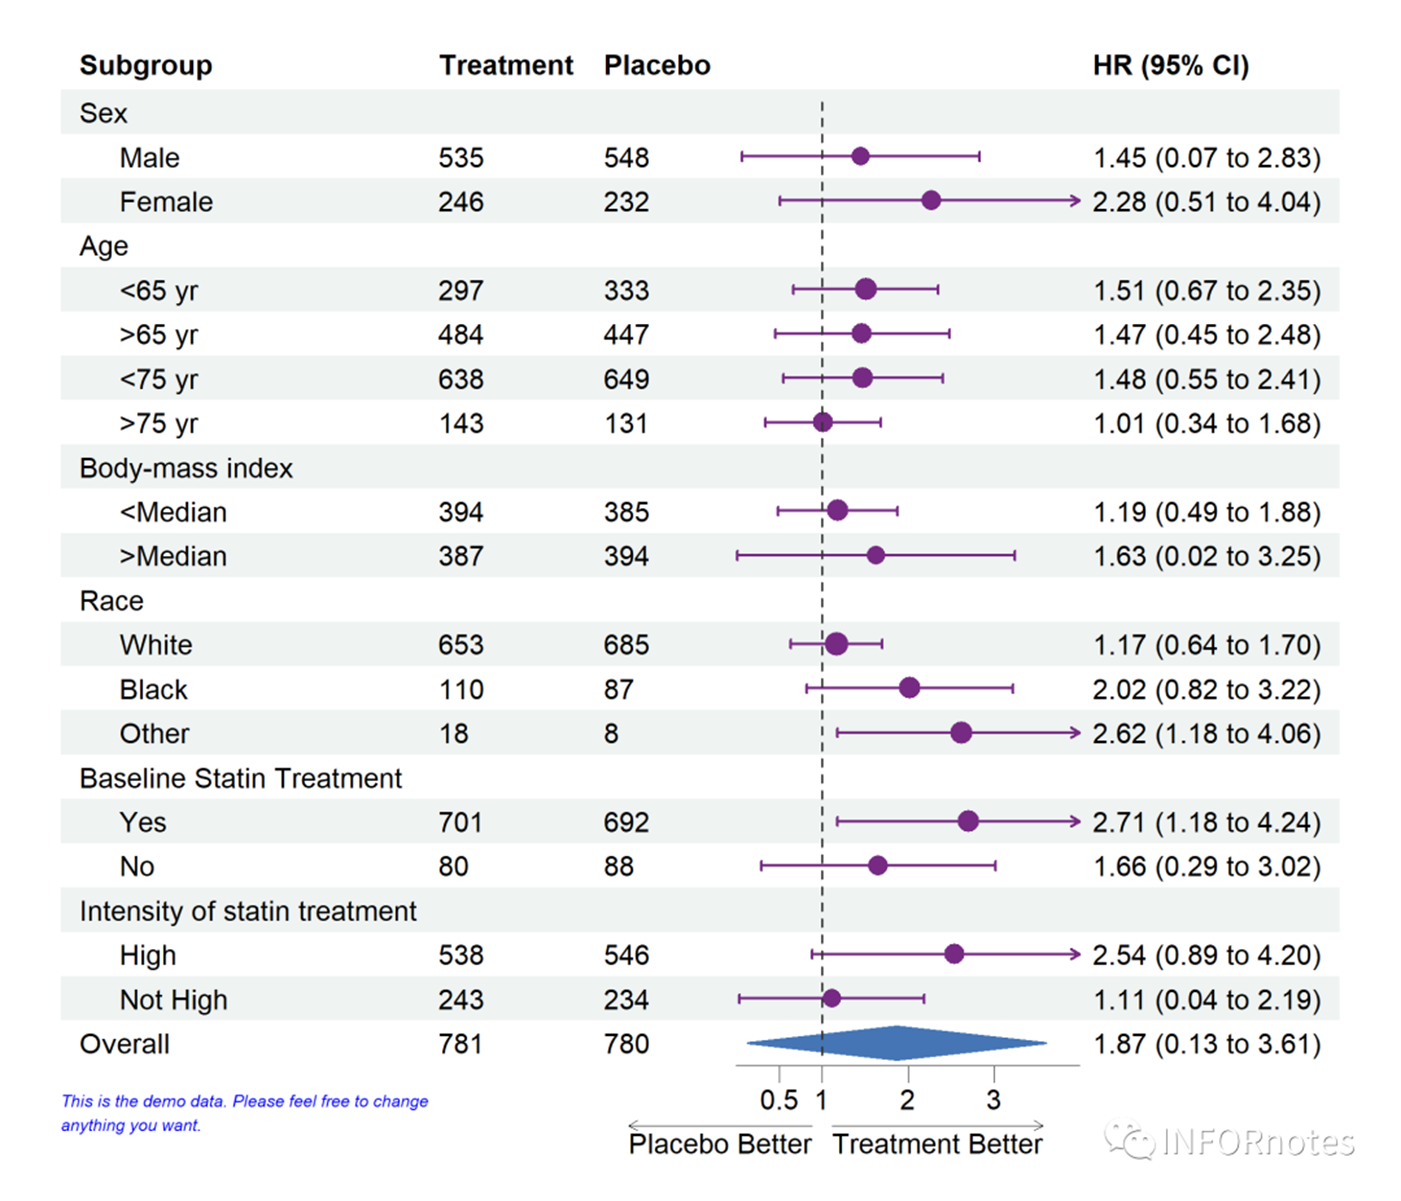
增加汇总列并修改图形参数
dt_tmp <- rbind(dt[-1, ], dt[1, ])dt_tmp[nrow(dt_tmp), 1] <- "Overall"# Define themetm <- forest_theme(base_size = 10, # Confidence interval point shape, line type/color/width ci_pch = 16, ci_col = "#762a83", ci_lty = 1, ci_lwd = 1.5, ci_Theight = 0.2, # Set an T end at the end of CI # Reference line width/type/color refline_lwd = 1, refline_lty = "dashed", refline_col = "grey20", # Vertical line width/type/color vertline_lwd = 1, vertline_lty = "dashed", vertline_col = "grey20", # Change summary color for filling and borders summary_fill = "#4575b4", summary_col = "#4575b4", # Footnote font size/face/color footnote_cex = 0.6, footnote_fontface = "italic", footnote_col = "blue")pt <- forest(dt_tmp[,c(1:3, 8:9)], est = dt_tmp$est, lower = dt_tmp$low, upper = dt_tmp$hi, sizes = dt_tmp$se, is_summary = c(rep(FALSE, nrow(dt_tmp)-1), TRUE), ci_column = 4, ref_line = 1, arrow_lab = c("Placebo Better", "Treatment Better"), xlim = c(0, 4), ticks_at = c(0.5, 1, 2, 3), footnote = "This is the demo data. Please feel free to change\nanything you want.", theme = tm)# Print plotplot(pt)
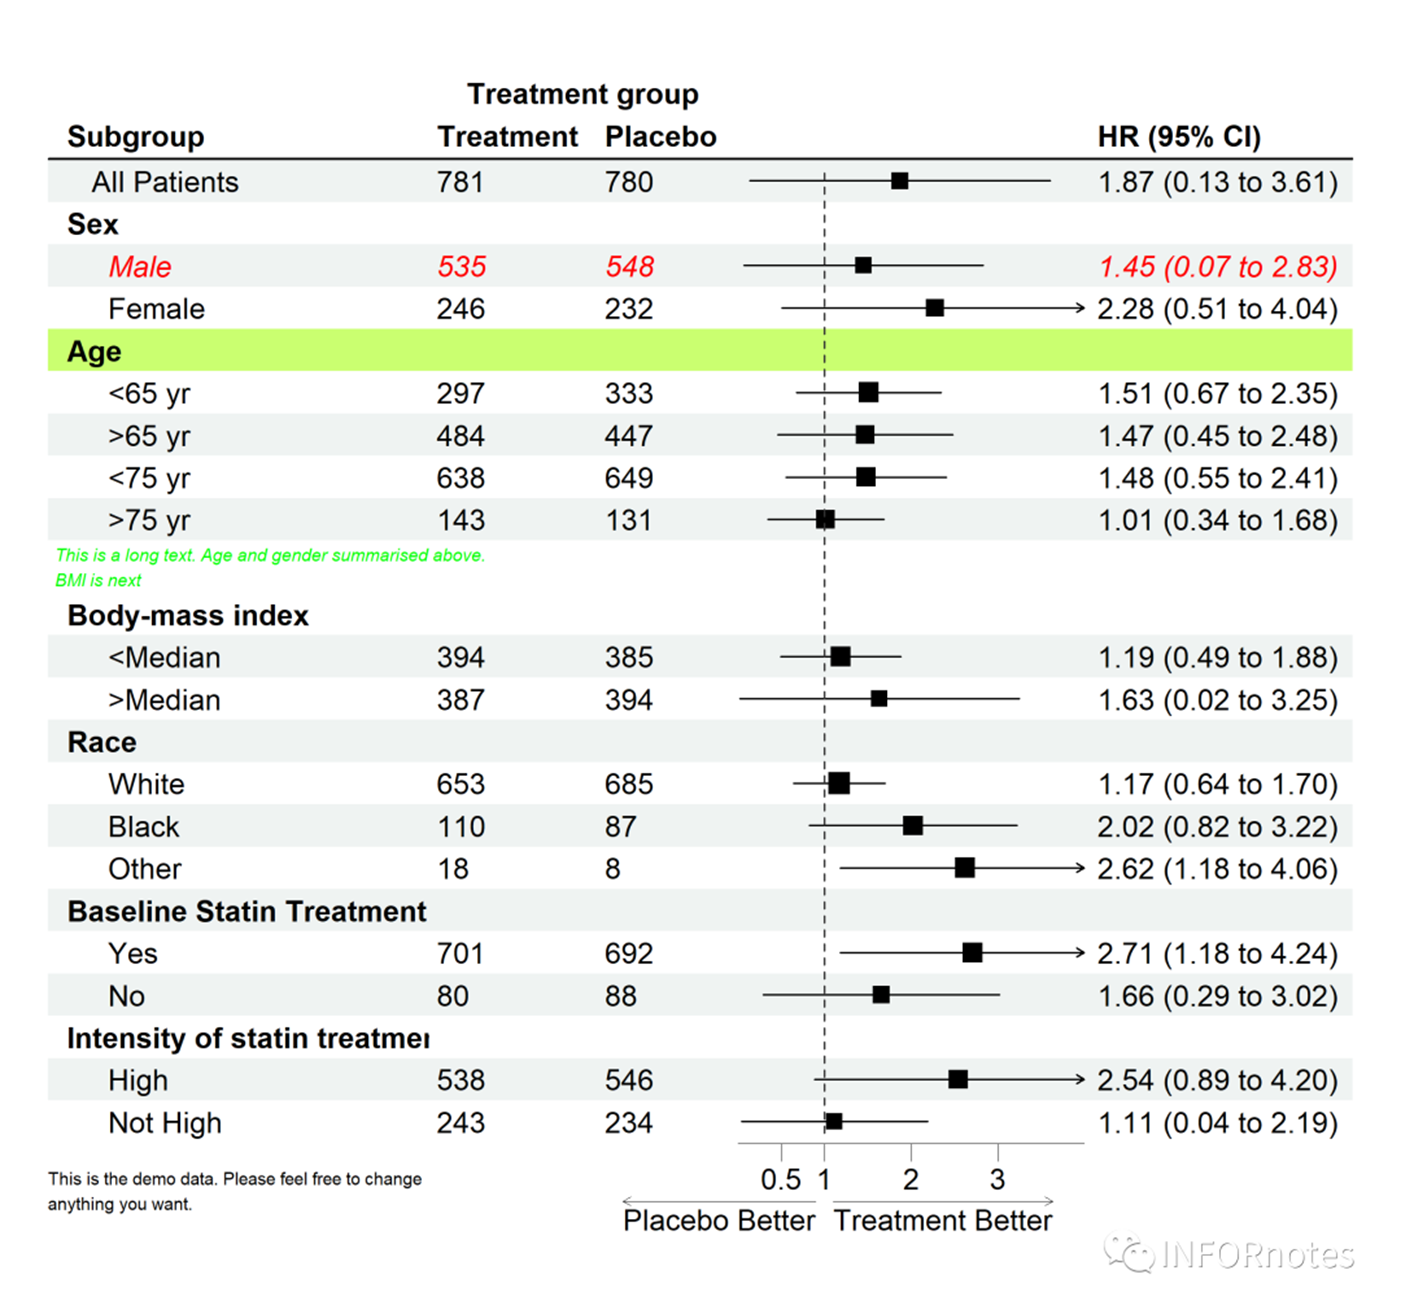
编辑森林图
edit_plot可用于更改某些列或行的颜色或字体。
add_underline该函数可用于向特定行添加边框。
add_text该函数可用于向某些行/列添加文本。
insert_text该函数可用于在某一行之前或之后插入行并添加文本。
# Change text color in row 3g <- edit_plot(p, row = 3, gp = gpar(col = "red", fontface = "italic"))# Bold grouping textg <- edit_plot(g, row = c(2, 5, 10, 13, 17, 20), gp = gpar(fontface = "bold"))# Edit background of row 5g <- edit_plot(g, row = 5, which = "background", gp = gpar(fill = "darkolivegreen1"))# Insert text at topg <- insert_text(g, text = "Treatment group", col = 2:3, part = "header", gp = gpar(fontface = "bold"))# Add underline at the bottom of the headerg <- add_underline(g, part = "header")# Insert textg <- insert_text(g, text = "This is a long text. Age and gender summarised above.\nBMI is next", row = 10, just = "left", gp = gpar(cex = 0.6, col = "green", fontface = "italic"))plot(g)
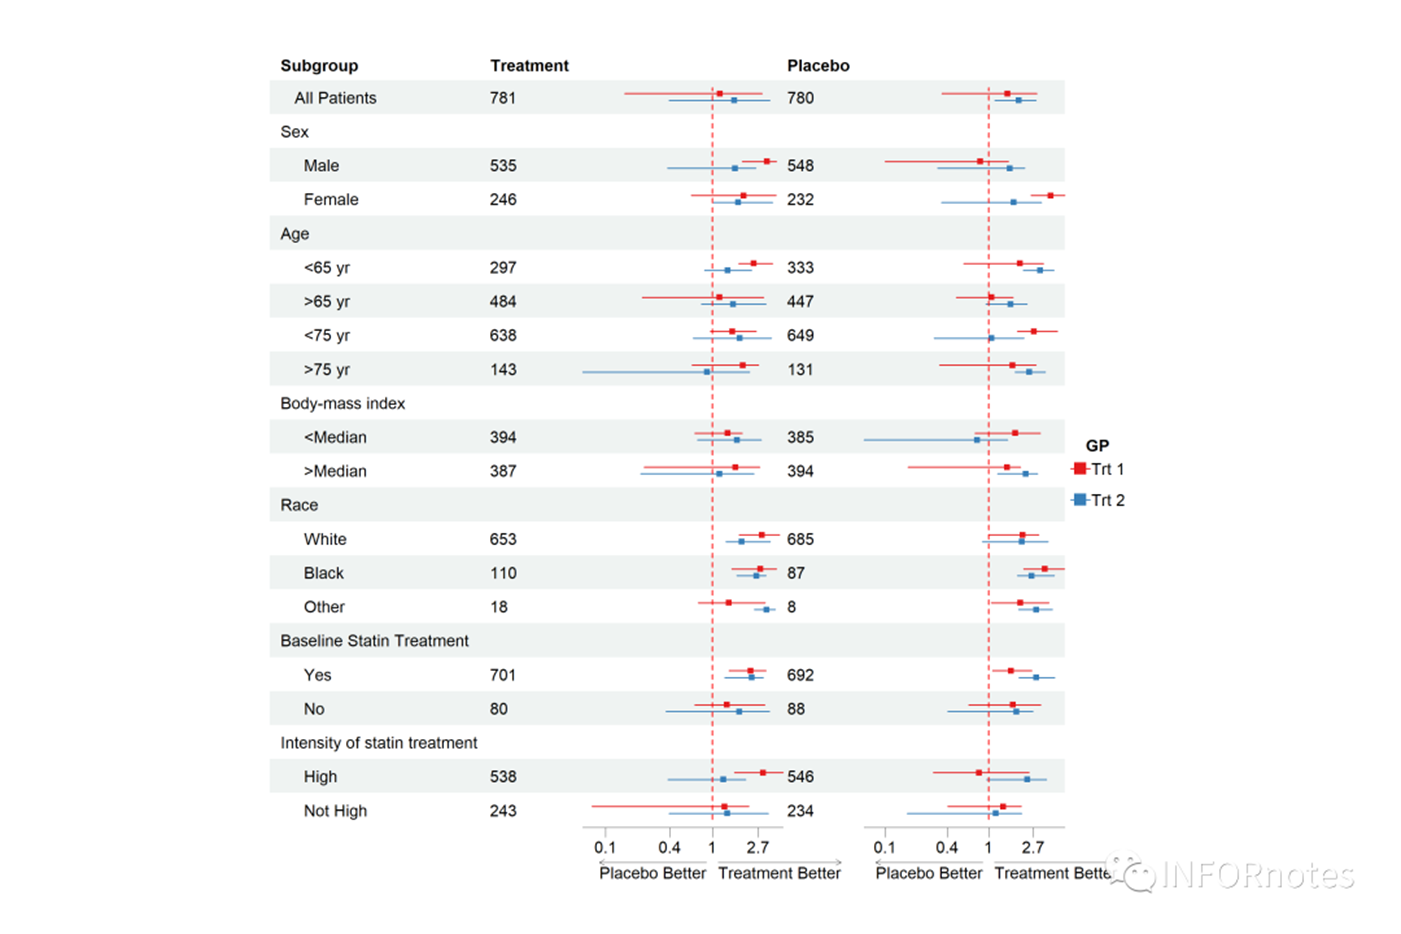
多个CI列
对于更复杂的示例,比如按组绘制CI。只需提供另一组est,lower和upper。如果提供的est、lower和upper的数目大于绘制CI的列号,则est、lower和upper将被重用。如下例所示,est_gp1和est_gp2将画在第3列和第5列中。但是est_gp3和est_gp4还没有被使用,它们将再次被绘制到第3列和第5列。因此,将est_gp1和est_gp2视为组1,est_gp3和est_gp4视为组2
# Add blank column for the second CI columndt$` ` <- paste(rep(" ", 20), collapse = " ")# Set-up themetm <- forest_theme(base_size = 10, refline_col = "red", footnote_col = "blue", legend_name = "GP", legend_value = c("Trt 1", "Trt 2"))p <- forest(dt[,c(1:2, 20, 3, 22)], est = list(dt$est_gp1, dt$est_gp2, dt$est_gp3, dt$est_gp4), lower = list(dt$low_gp1, dt$low_gp2, dt$low_gp3, dt$low_gp4), upper = list(dt$hi_gp1, dt$hi_gp2, dt$hi_gp3, dt$hi_gp4), ci_column = c(3, 5), ref_line = 1, arrow_lab = c("Placebo Better", "Treatment Better"), nudge_y = 0.2, xlog = TRUE, theme = tm)plot(p)
转载自《生信技能树》,如有侵权,请联系删除。